Supabase Realtime is an Elixir server that sends database changes, broadcasts and presence to clients over Phoenix Channels. It extends the Channels protocol with binary broadcasts of its own, which makes it a good example of load testing a real Phoenix system that goes beyond the defaults.
I've tested it twice: on my laptop first, to get the protocol right, and then on AWS, to see how far one machine can go.
50,000 users on one machine
I wanted to try a real product and not just a test app, so I ran Realtime's open source release on AWS and load tested it with Stampede. One 4-core machine held 50,000 users for 10 minutes with no errors, and delivered 80.9 million messages, with a round trip of 5.71ms at p95.
This is the open source server on my own machines. None of it ran on Supabase's hosted service, and it isn't a measure of that service.
| Server | One r7g.xlarge: 4 Graviton cores, 32 GB |
| Load | Three more r7g.xlarge in the same zone |
| Realtime | The official supabase/realtime:v2.150.2 image |
| Postgres | supabase/postgres:17.11.0.007, on the same machine |
Each user does what realtime-js does: protocol 2.0.0, with a heartbeat every 25
seconds. There are 100 users in each channel, which is the shape of
Supabase's own large-scale benchmark.
Each one sends a broadcast every 30 to 60 seconds, which everyone in the channel
receives, so each channel gets about 2 messages a second. They connect with
self: true and ack: true, so they can time their own message coming back.
I didn't tune anything. I only raised the limits that would stop a test from
reaching the server's capacity: the per-tenant limits, which protect a shared
service, and MAX_CONNECTIONS.
First I went up 10,000 users at a time, ramping each step for 60 seconds and holding it for 60. A step passed if joins and round trips stayed under 1 second at p95, with no errors:
| Users | Join p95 | Round trip p95 | Server CPU | Server memory |
|---|---|---|---|---|
| 10,000 | 5.27ms | 1.72ms | 17% | 1.8 GB |
| 20,000 | 5.94ms | 2.02ms | 33% | 2.6 GB |
| 30,000 | 6.31ms | 2.52ms | 50% | 3.3 GB |
| 40,000 | 8.69ms | 3.53ms | 67% | 4.0 GB |
| 50,000 | 17.16ms | 6.44ms | 82% | 4.7 GB |
At 60,000 the server ran out of CPU. Messages still came back in 75ms and nothing
crashed, but joins went just over the limit, at 1.06s, so 50,000 is the number.
The full record, with that step, is in
bench/million.
A 60-second hold doesn't prove much, so I then ramped up to 50,000 over 5 minutes and held them for 10, the length of Supabase's broadcast benchmark:
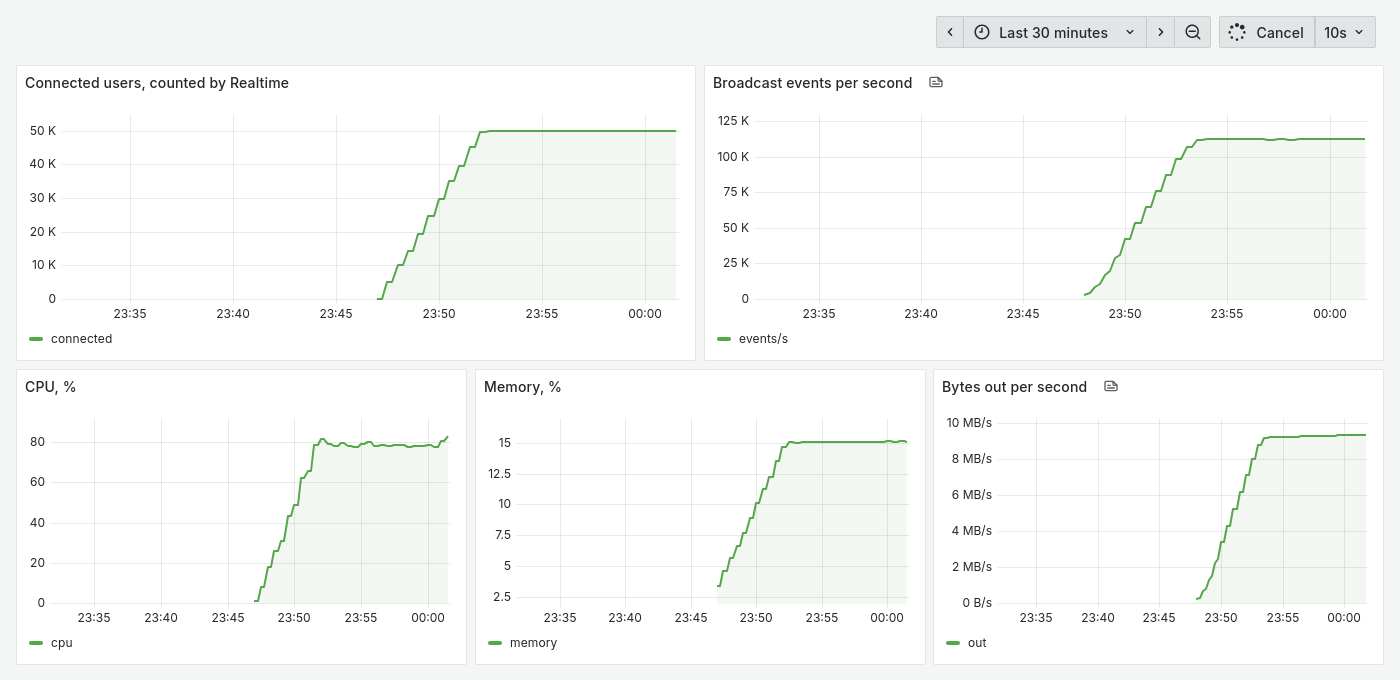
| Messages delivered | 80.9 million, about 111,000 a second while holding |
| Round trip | p50 1.75ms, p95 5.71ms, p99 10.62ms, slowest 65.53ms |
| Join p95 | 17.51ms |
| Server | 79% CPU, 4.7 GB of memory |
This is Realtime's own /metrics during that run, in Grafana:
Why I trust it
A load test saying it did well doesn't prove much, so I checked it against things that don't come from Stampede:
- Realtime counted the users itself. Its own metric peaked at 50,001, which is the 50,000 users and one real browser. The Linux kernel showed 50,025 established connections.
- A real client was in the room.
realtime-jsin Firefox joined one of the channels during the run. It received the load test's messages, and the load test received its messages too. - Every message arrived. Each broadcast should reach 100 people. That's 80,922,500 deliveries, counting the browser's, and 80,919,126 arrived, which is 99.996%. The last few were probably still on their way when the run ended.
- The server's log is clean. Realtime logged no errors or warnings until the run ended, when 50,000 users disconnected at once and it logged some warnings about long message queues. In the find-limit run, the first error came in the step that failed, at 60,000.
- The load machines weren't the limit. They peaked at 51% busy.
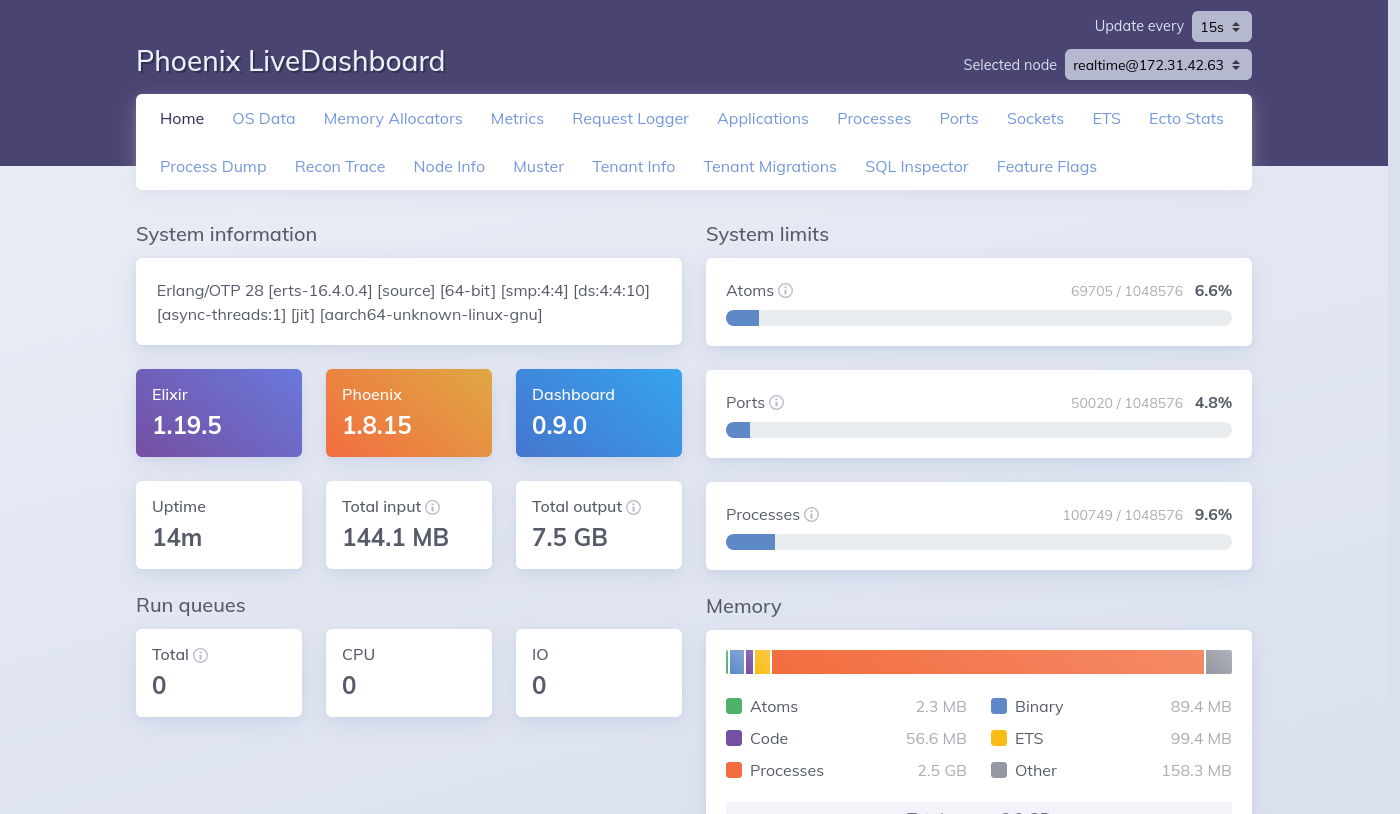
Phoenix LiveDashboard, running inside Realtime, shows the 4 schedulers on Arm, about 50,000 ports and two processes for each user:
What it doesn't show
- This is broadcast on public channels. There's no row level security and no Postgres Changes, and both of those cost more.
- There's no TLS. It's plain
ws://inside one AWS zone, so real users would see their own network on top, and something has to terminate TLS. - It's one workload. CPU went up steadily with users here because every message goes to 100 people. A channel size of 10 or 1,000 would land somewhere else, and memory wouldn't be the limit until far more users. It was only 15% full.
- It isn't comparable to Supabase's own numbers. They publish 250,000 users and over 800,000 messages a second on a cluster of 2 to 6 nodes. Mine is one node, for a different question: how far does one machine go?
To run it yourself, the scripts are in
bench/million.
On my laptop
I started with a local Realtime, from a checkout of its repository, with a tenant of its own. Realtime limits how many users, joins and events each tenant may have, to protect production servers, so I raised that tenant's limits first.
Speaking Realtime's protocol
Realtime's clients connect with an API key, and join each channel with an access token, a JWT signed with the tenant's secret. A few helpers keep that out of the scenarios:
defmodule RealtimeLoad do
  def connect do
    url = "ws://#{tenant()}.localhost:4000/socket"
    Stampede.Channels.connect(url, params: %{apikey: token()}, serializer: RealtimeLoad.Serializer)
  end

  def join(socket, channel, config) do
    Stampede.Channels.join(socket, "realtime:" <> channel, %{config: config, access_token: token()})
  end

  # A JWT signed with the tenant's secret, like the one an anonymous user has.
  def token do
    header = encode(%{alg: "HS256", typ: "JWT"})
    claims = encode(%{role: "anon", iss: "stampede", exp: System.os_time(:second) + 3_600})
    signature = :crypto.mac(:hmac, :sha256, System.get_env("JWT_SECRET", "dev"), header <> "." <> claims)
    header <> "." <> claims <> "." <> Base.url_encode64(signature, padding: false)
  end

  defp tenant, do: System.get_env("TENANT", "realtime-dev")
  defp encode(map), do: map |> JSON.encode!() |> Base.url_encode64(padding: false)
end
With Phoenix's "2.0.0" protocol, Realtime sends and receives broadcasts as
binary frames of its own, as realtime-js does. A
Stampede.Channels.Serializer adds them to the built-in serializer, and
leaves every other message to it:
defmodule RealtimeLoad.Serializer do
  @behaviour Stampede.Channels.Serializer

  alias Stampede.Channels.Message
  alias Stampede.Channels.Serializer.V2

  @user_broadcast_push 3
  @user_broadcast 4

  # Broadcasts go out as user broadcast pushes, with a JSON payload.
  @impl true
  def encode(%Message{event: "broadcast", payload: %{type: "broadcast", event: event} = payload} = message) do
    data = JSON.encode!(Map.get(payload, :payload, %{}))
    join_ref = message.join_ref || ""
    ref = message.ref || ""

    header =
      <<@user_broadcast_push, byte_size(join_ref), byte_size(ref), byte_size(message.topic),
        byte_size(event), 0, 1>>

    {:binary, header <> join_ref <> ref <> message.topic <> event <> data}
  end

  def encode(message), do: V2.encode(message)

  # They come back as user broadcasts, read into the same payloads as with
  # the JSON protocol.
  @impl true
  def decode(
        {:binary,
         <<@user_broadcast, topic_size, event_size, metadata_size, 1,
           topic::binary-size(topic_size), event::binary-size(event_size),
           _metadata::binary-size(metadata_size), data::binary>>}
      ) do
    payload = %{"type" => "broadcast", "event" => event, "payload" => JSON.decode!(data)}
    {:ok, %Message{topic: topic, event: "broadcast", payload: payload}}
  end

  def decode(frame), do: V2.decode(frame)
end
Broadcast
Every user joins the same channel and sends a broadcast a second, with
self: true so that it comes back to them, and times the round trip:
defmodule RealtimeLoad.Broadcast do
  use Stampede.Scenario

  @impl true
  def options do
    [
      stages: [{[second: 10], 50}, {[second: 30], 50}, {[second: 5], 0}],
      graceful_stop: [second: 15],
      thresholds: [{"broadcast.roundtrip", p95: 100}, {"iteration.errors", count: 0}]
    ]
  end

  @impl true
  def run(vu) do
    {:ok, socket} = RealtimeLoad.connect()
    {:ok, _reply} = RealtimeLoad.join(socket, "load", %{broadcast: %{self: true, ack: true}})

    for i <- 1..10 do
      id = "#{vu.id}-#{vu.iteration}-#{i}"
      message = %{type: "broadcast", event: "shout", payload: %{id: id}}

      Stampede.measure("broadcast.roundtrip", fn ->
        {:ok, _ack} =
          Stampede.Channels.push(socket, "realtime:load", "broadcast", message, metric: "broadcast.ack")

        {:ok, _message} =
          Stampede.Channels.await(socket, "realtime:load", "broadcast",
            match: &(&1["payload"]["id"] == id)
          )
      end)

      Process.sleep(1_000)
    end
  end
end
Every broadcast goes to everyone in the channel, so with n users, the
server delivers n times as many messages as it receives.
For the run on AWS, realtime-js sends a heartbeat every 25 seconds, so the
scenario does too, with heartbeat_interval: 25_000. In a channel of 100, each
user hears far more than it reads, so it passes keep: &(&1["payload"]["from"] == vu.id) to Stampede.Channels.connect/2, and only holds on to its own messages.
Presence and Postgres Changes
The two other scenarios follow the same shape:
- Presence. Every user joins one channel, tracks itself, and times how
long it takes to see its own join in a
presence_diff, as in the Phoenix Presence guide. - Postgres Changes. Every user subscribes to the inserts of its own
rows, with a filter on a column. It then inserts a row a second with
Postgrex, and times how long Realtime takes to deliver it. The scenario's
Stampede.Scenario.setup/1creates the table and adds it to Realtime's publication.
Laptop results
Realtime 2.146.0, in dev mode, with the load test on the same laptop (i5-13420H, 12 threads, 16 GB). At 400 users my laptop was 85% to 90% busy running both, so read the larger runs as a floor for what Realtime can do, not its limit. No run had errors, dropped connections or failed connections.
Broadcast, every user in one channel, for 30 seconds:
| Users | Protocol | Messages delivered/s | Round trip p50 | p95 | p99 |
|---|---|---|---|---|---|
| 50 | 2.0.0 | 2,400 | 2.8ms | 11ms | 33ms |
| 200 | 2.0.0 | 36,600 | 23ms | 140ms | 171ms |
| 400 | 2.0.0 | 128,400 | 100ms | 306ms | 680ms |
| 200 | 1.0.0 | 36,300 | 24ms | 132ms | 189ms |
| 400 | 1.0.0 | 133,500 | 88ms | 282ms | 456ms |
Presence, ramping up to 200 users: users saw their own join 2.5ms after tracking themselves at p50, 6.7ms at p95 and 10.4ms at p99, over 297,000 messages.
Postgres Changes, one insert a second per user for 30 seconds, with a
poll_interval_ms of 100:
| Users | Changes | p50 | p95 | p99 |
|---|---|---|---|---|
| 1 | 30 | 33ms | 504ms | 514ms |
| 10 | 300 | 41ms | 504ms | 525ms |
| 25 | 750 | 68ms | 525ms | 546ms |
| 50 | 1,250 | 152ms | 568ms | 603ms |
| 100 | 2,000 | 447ms | 918ms | 1.04s |
What the numbers showed
- Messages delivered grew with the square of the users, as they should when everyone hears everyone, and the binary protocol performed like JSON. At 400 users the shared laptop was close to out of CPU, which likely accounts for much of the latency.
- Postgres Changes had a p95 of about 500ms even with a single user, which
surprised me at first. It's the poller backing off to five times
poll_interval_mswhile idle, so the first change after a quiet moment waits for the next poll. That's documented behavior, not a bug. - Postgres Changes latency grew with the number of subscribers, as Realtime's docs describe: every change is checked against the access of every subscriber.
Stampede took care of the connections, heartbeats and replies, so apart from the serializer and a few helpers, the scenarios above are the whole load test.