Stampede has its own dashboard, and for most runs that's all you need. This is for when you already keep your app's metrics in Grafana and want the load on the same screen, so you can see the latency climb next to the thing that made it climb.
Stampede emits a :telemetry event for every timing, counter and check, and one
per second for the run itself. They're listed in the Stampede docs. So all
you need to do is pass those on to Prometheus.
Exposing the metrics
Add the reporter next to Stampede:
# mix.exs
{:telemetry_metrics_prometheus, "~> 1.1", only: [:dev, :test]}
Then start it from your scenario's setup/1, so it only runs during a load
test. This one tests a channel from mix phx.gen.channel Room:
defmodule MyApp.Load.Lobby do
  use Stampede.Scenario

  import Telemetry.Metrics

  @impl true
  def options do
    [stages: [{[second: 30], 200}, {[minute: 1], 200}, {[second: 10], 0}]]
  end

  @impl true
  def setup(_opts) do
    {:ok, _apps} = Application.ensure_all_started(:telemetry_metrics_prometheus)
    {:ok, _reporter} = TelemetryMetricsPrometheus.start_link(metrics: metrics())
    :ok
  end

  @impl true
  def run(_vu) do
    {:ok, socket} = Stampede.Channels.connect("ws://localhost:4000/socket")
    {:ok, _reply} = Stampede.Channels.join(socket, "room:lobby")

    for _ping <- 1..10 do
      {:ok, reply} = Stampede.Channels.push(socket, "room:lobby", "ping", %{"n" => 1})
      Stampede.check("ping came back", reply == %{"n" => 1})
      Process.sleep(1_000)
    end
  end

  defp metrics do
    [
      last_value("stampede.run.interval.vus"),
      distribution("stampede.timing.duration",
        tags: [:name],
        unit: {:native, :millisecond},
        reporter_options: [buckets: [1, 2, 3, 5, 10, 25, 50, 100, 250, 500, 1_000, 2_500, 5_000]]
      ),
      sum("stampede.counter.count", tags: [:name]),
      counter("stampede.check.count",
        tags: [:name, :passed],
        tag_values: &Map.put(&1, :passed, &1.passed?)
      )
    ]
  end
end
A few things in there aren't obvious, and I got the first one wrong when I tried this:
ensure_all_startedis needed.mix stampede.runloads your app but doesn't start it, so without this the reporter's web server crashes.- Durations are in native time units, as usual for telemetry, so the
unit:converts them to milliseconds. - Counters use
sum, notcounter.counter/2counts events, but one[:stampede, :counter]event can add more than 1, in itscount. passed?is renamed, because a Prometheus label can't have a?.
Metrics are now at http://localhost:9568/metrics for as long as the run lasts.
Running Prometheus and Grafana
Save this as prometheus.yml:
global:
  scrape_interval: 5s

scrape_configs:
  - job_name: stampede
    static_configs:
      - targets: ["localhost:9568"]
Start both, and then your run:
$ docker run --network host -v "$PWD/prometheus.yml:/etc/prometheus/prometheus.yml" prom/prometheus:v3.5.0
$ docker run --network host grafana/grafana:12.2.0
$ mix stampede.run loadtest/lobby.exs
Open Grafana at http://localhost:3000, sign in with admin and admin, and add a
Prometheus data source at http://localhost:9090.
On a Mac, Docker can't share the host's network. Use -p 9090:9090 and
-p 3000:3000 instead, with host.docker.internal:9568 as the target and
http://host.docker.internal:9090 as the data source.
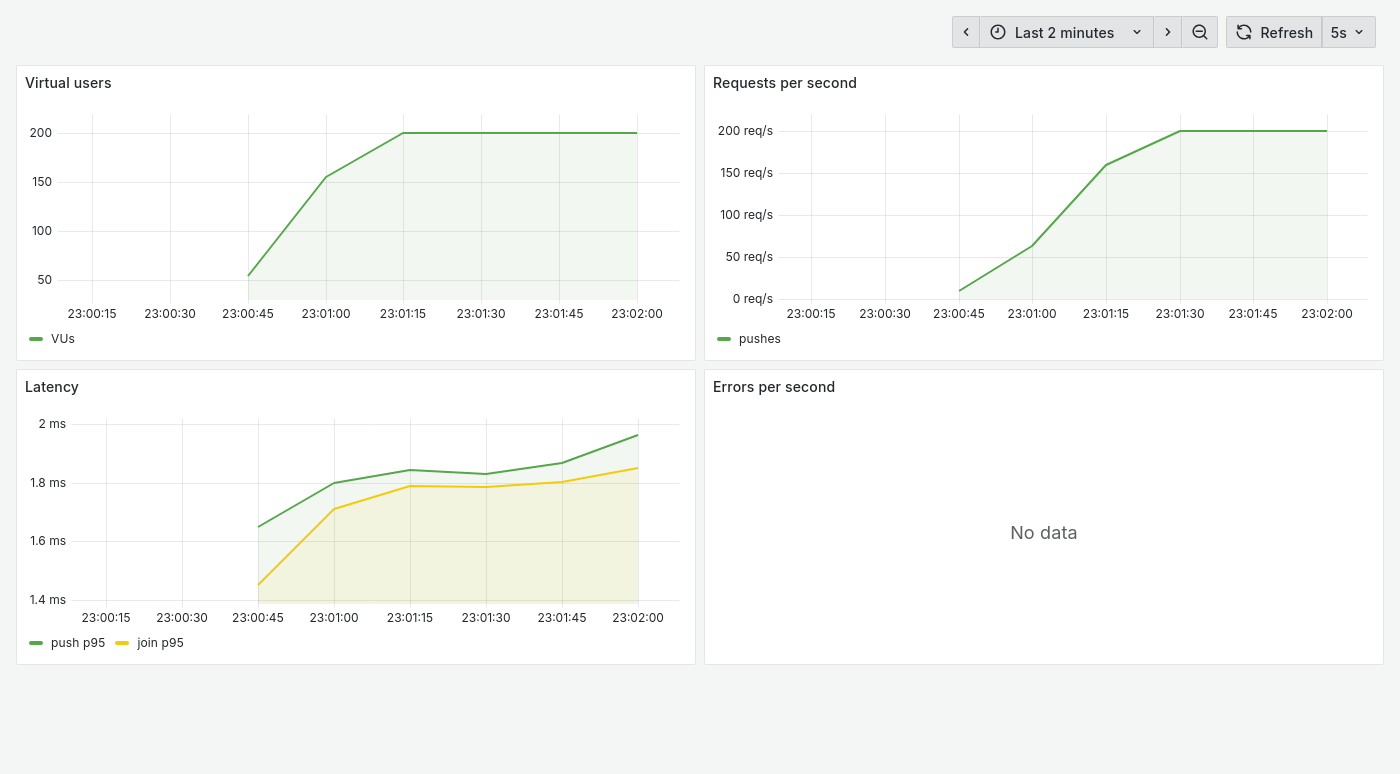
Panels worth having
| Panel | Query |
|---|---|
| Virtual users | stampede_run_interval_vus |
| Requests per second | rate(stampede_timing_duration_count{name="channel.push"}[30s]) |
| p95 latency, in ms | histogram_quantile(0.95, sum by (le) (rate(stampede_timing_duration_bucket{name="channel.push"}[30s]))) |
| Errors per second | sum(rate(stampede_counter_count{name=~".*errors"}[30s])) or vector(0) |
Change name to any metric from your summary, like live.join or
http.request. The or vector(0) is there because a counter doesn't exist until
the first error, so without it a clean run says "No data" rather than 0.
What to trust
Keep the summary Stampede prints at the end as your real number. Grafana is for watching the run as it happens.
Prometheus works out a percentile from buckets, so it's an estimate. For the run in that picture, Stampede measured a push p95 of 1.62ms, and Prometheus said about 1.85ms. Before I added the 2 and 3 buckets, with nothing between 1 and 5, a similar run was 2.14ms in Stampede and about 4.5ms in Grafana. So put your buckets close together around the latency you care about. Stampede's own timings are always within 1%.
The rest of the differences are small. Prometheus only sees what it scrapes, so it can miss the last few seconds of a run, which was 2 pushes out of about 16,000 for me. And the reporter goes away when the run ends, so Prometheus shows the target as down until the next one, which is fine.
With --nodes, each node emits the events of its own VUs, and setup/1 only runs
on one of them, so this only sees that node's share. Stampede merges all of them
for the summary, so that's still the number to use.